The 10 Most Important Manufacturing KPIs in Industry 4.0
In the dynamic Saltillo–Monterrey industrial corridor, managing manufacturing plants and automotive supply chain suppliers requires complete visibility into every process. Traditionally, decisions on the production floor were based on the supervisor's visual experience or on reports consolidated at the end of the week. Today, digital transformation demands an approach driven by real-time data.
For a plant to be profitable, agile, and globally competitive, it is essential to define and implement KPIs (Key Performance Indicators). However, measuring too many variables tends to overwhelm engineering and operations teams, diluting focus on what truly matters.
In this article we take an in-depth look at the 10 most important and widely used manufacturing KPIs, grouped by strategic area. We'll see how they are calculated, what problems they reveal, and how digitizing them accelerates the transition toward smart manufacturing.
Overall Efficiency and Productivity KPIs
1. OEE (Overall Equipment Effectiveness)
OEE is the global benchmark metric for evaluating the productivity of a machine, production line, or entire plant. It measures the percentage of planned production time that is truly productive by multiplying three critical factors: Availability, Performance, and Quality.
Formula:
Why it matters:
A low OEE immediately exposes the "hidden factory" — the production capacity being lost to mechanical failures, micro-stoppages, or manufacturing defects. Monitoring it automatically through industrial dashboards allows management to take corrective action before the delivery schedule is affected.
2. Production Throughput
This indicator measures the quantity of good products or parts that a machine, line, or plant produces in a given period (for example, per hour, shift, or day).
Formula:
Why it matters:
It is the direct thermometer of the plant's pace. If Throughput suddenly drops, it signals a bottleneck or a technical problem on the line. By integrating it with mobile monitoring apps, supervisors receive instant alerts whenever the operating pace falls.
Quality and Waste KPIs
3. First Time Yield (FTY)
FTY measures the number of units that complete the production process perfectly on the first attempt, without requiring adjustments or rework and without being discarded as scrap.
Formula:
Why it matters:
In automotive manufacturing governed by the IATF 16949 standard, rework hides tooling inefficiencies and drives up labor costs. A high FTY ensures a steady production flow and optimizes material usage.
4. Scrap Rate (Waste Percentage)
Measures the amount of raw material or finished product rendered unusable by irreparable quality defects during the manufacturing process.
Formula:
Why it matters:
Scrap directly impacts the company's finances. Identifying and classifying scrap with business intelligence (BI) tools helps quality teams determine whether the problem stems from a defective material batch, machine miscalibration, or operator error.
Maintenance and Downtime KPIs
5. MTBF (Mean Time Between Failures)
A reliability indicator that measures the average time elapsed between one mechanical or electrical failure and the next in a critical piece of equipment or system.
Formula:
Why it matters:
A high MTBF means the equipment is reliable and that preventive and predictive maintenance routines are working. If MTBF declines, it is a warning sign for engineering to inspect machine wear.
6. MTTR (Mean Time To Repair)
Measures the efficiency of the technical maintenance team. It represents the average time required to diagnose, repair, and restart a machine from the moment an unplanned stoppage occurs.
Formula:
Why it matters:
While MTBF aims for machines to fail less often, MTTR aims for them to be repaired as quickly as possible when they do. Digitizing maintenance alerts with software speeds up response times by sending automatic notifications to the qualified technician.
Logistics and Internal Supply Chain KPIs
7. Production Attainment
Measures the plant's ability to meet the production targets set by the planning department within the scheduled time.
Formula:
Why it matters:
Low plan attainment leads to late customer deliveries, insufficient safety stock, or extraordinary costs such as premium freight — a critical situation for the automotive supply sector (Tier 1 and Tier 2).
8. Raw Material Inventory Turnover
Measures how many times the materials inventory is replenished during a specific period (usually a month or a year).
Formula:
Why it matters:
Holding excess material in warehouses in Monterrey or Saltillo ties up working capital and raises storage costs. High turnover, backed by traceability systems and inventory software, demonstrates an agile supply chain under Just-In-Time principles.
Cost and Safety KPIs
9. Unit Manufacturing Cost
Consolidates all costs associated with producing a single item, including raw materials, direct labor, and plant overhead (energy, depreciation, etc.).
Formula:
Why it matters:
It is the ultimate financial indicator on the production floor. It shows whether Lean Manufacturing and automation initiatives are succeeding in reducing operating costs and improving the business's profit margin.
10. Health and Safety Incident Rate
Measures the frequency of accidents or injuries recorded at the plant per 100 full-time workers over a given period.
Formula:
(Note: The 200,000 factor is the international standard representing the hours worked by 100 employees in one year).
Why it matters:
No plant can be efficient if it isn't safe. Monitoring this indicator and backing it with smart video surveillance infrastructure and automated access control ensures a safe work environment and reduces legal or operational penalties.
Why You Should Centralize Your KPIs in Real-Time Dashboards
Measuring these 10 KPIs is only the first step. The real value lies in how the information is consumed. Plants that still process this data manually or through weekly spreadsheets are driving by "the rear-view mirror": they learn about problems when it's too late to fix them.
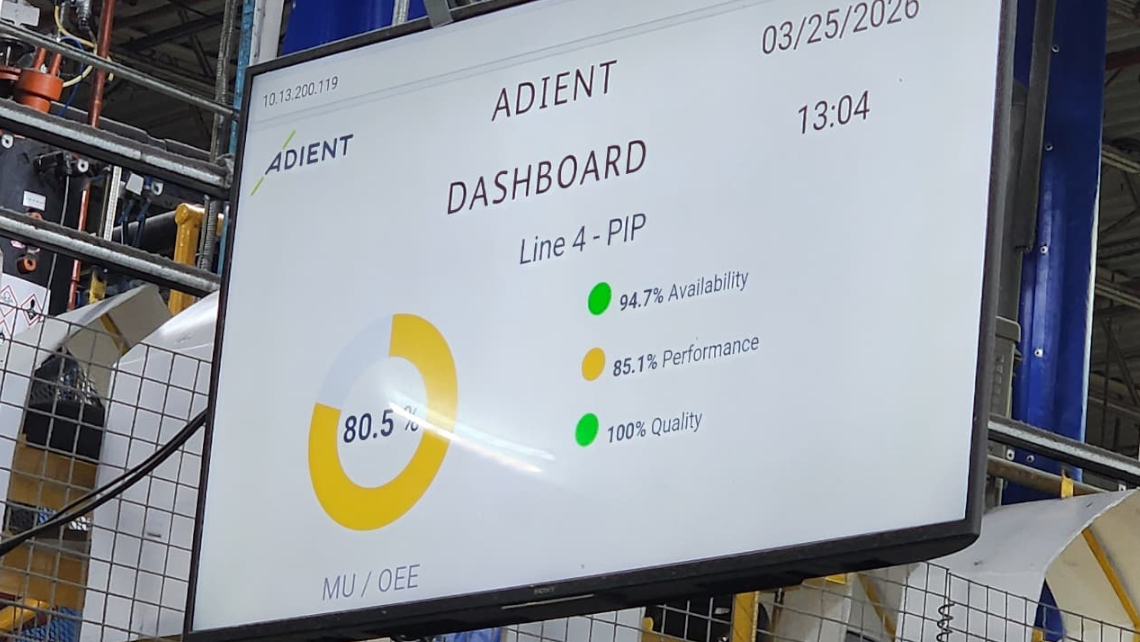
Digital transformation and Industry 4.0 solve this by integrating Real-Time Dashboards:
- Direct Connectivity: They connect machine sensors, PLCs, and management systems to capture information instantly.
- Clear Visualization (UI/UX): They translate complex formulas into intuitive charts and color codes (Green/Yellow/Red) that any operator or executive can understand at a glance.
- Proactive Decision-Making: They detect deviations in Scrap or Throughput within minutes of the shift starting, giving the engineering team time to step in immediately.
Conclusion
Setting up a scorecard with these 10 key KPIs transforms the operation of any manufacturing plant in Saltillo and Monterrey. By unifying productivity, quality, maintenance, inventory, and safety metrics, organizations gain the operational discipline needed to compete with the most demanding global standards.
If your plant still relies on handwritten reports or outdated Excel files to evaluate productivity, it's time to take the step toward industrial digitalization.
Does your plant measure KPIs automatically, or do you still depend on manual reports?
Don't leave your production efficiency to chance. At LT CODER we build custom real-time KPI Dashboards and Indicators for the manufacturing and automotive industries in Saltillo and Monterrey. We connect your production lines to give you full visibility and decisions based on real data.
Schedule a demo with our digital transformation specialists