What Is OEE and How Do You Calculate It?
In the highly competitive environment of modern manufacturing in Mexico, especially in the automotive and industrial clusters of Saltillo and Monterrey, optimizing resources isn't optional; it's a requirement for survival. Production plants constantly face the challenge of reducing costs, improving quality, and meeting ever-tighter delivery times under Industry 4.0 models. To achieve this, one indicator has become the global gold standard for measuring productivity on the production floor: OEE, or Overall Equipment Effectiveness.
Despite its popularity, many manufacturing companies still calculate this indicator manually, late, or incorrectly, missing the opportunity to identify the true root causes of their inefficiencies. In this detailed article, we take an in-depth look at what OEE is, its components, how to calculate it step by step with real formulas, the most common mistakes when implementing it, and how real-time digitalization turns this metric into a competitive advantage.
What Is OEE (Overall Equipment Effectiveness)?
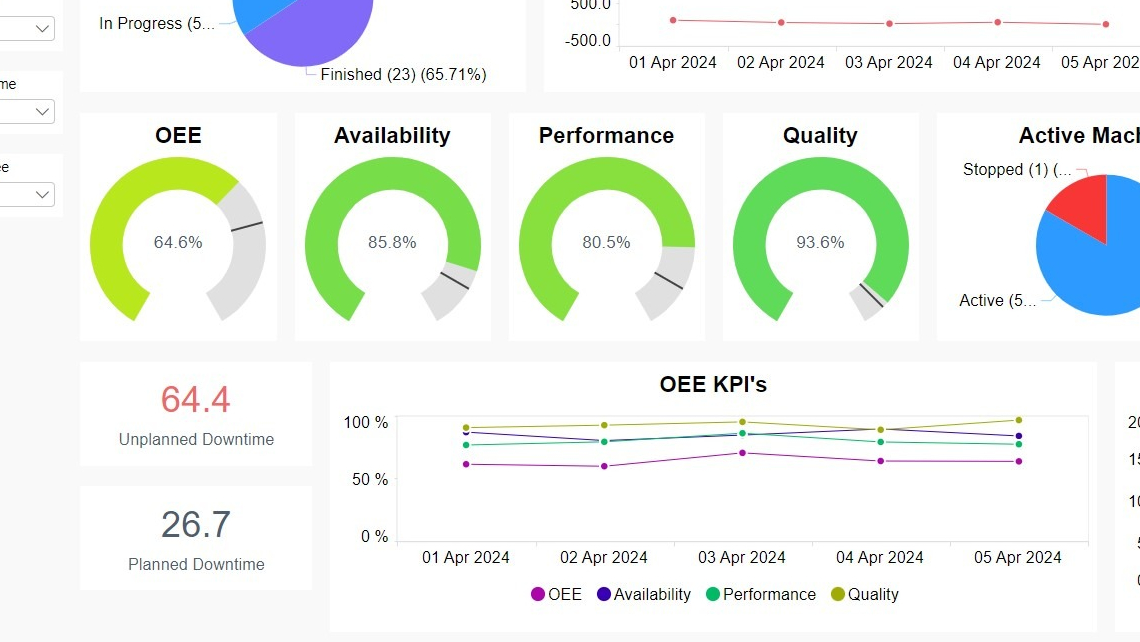
OEE is a quantitative metric that measures the percentage of planned production time that is truly productive. It was developed by Seiichi Nakajima in the 1960s as a fundamental part of Total Productive Maintenance (TPM). An OEE of 100% means the plant is producing only perfect parts (100% Quality), at the maximum designed speed (100% Performance), and without interruptions during the scheduled time (100% Availability).
Unlike other indicators that only measure how many parts were produced at the end of the shift, OEE digs into how they were produced, revealing the "hidden cost" or hidden factory: the production capacity that exists in the plant but is lost to mechanical failures, material shortages, micro-stoppages, or quality defects.
For companies in northern Mexico, which compete directly in global supply chains (as Tier 1 and Tier 2 automotive suppliers), OEE provides the common language that plant managers, process engineers, and corporate directors need to evaluate asset performance and justify investments in new technology.
The Three Pillars of OEE
The OEE calculation breaks down into three independent critical factors. Understanding each one is essential, since a low OEE can stem from completely different problems in each pillar.
1. Availability
Availability evaluates time losses related to production stoppages. It compares the time the machine was actually running with the time it was scheduled to work.
- Factors that affect it: Mechanical or electrical breakdowns, operator absence, raw material supply delays, and tooling changeover or setup times (setups and SMED).
- Key point: Time when the plant is closed for scheduled maintenance, holidays, or lack of demand is not included in the calculation, since no production was planned during those periods.
2. Performance
Performance measures the speed of the operation. It compares the speed at which the machine actually ran with the maximum speed it was designed for (its theoretical capacity or ideal cycle time).
- Factors that affect it: Machine wear that forces it to run at lower speed, operator inexperience, and micro-stoppages (brief stops of a few seconds that occur when a part jams or a sensor gets dirty, which are usually not recorded in paper logbooks).
Quality
Quality measures the proportion of good parts produced relative to the total number of parts produced.
- Factors that affect it: Defective parts that must be discarded (scrap), parts that need to be reprocessed (rework), and process instability during machine start-up, when the first parts often come out of specification.
The Impact of the "Six Big Losses" in Manufacturing
To improve OEE, you first need to understand what reduces it. In Industry 4.0, analysis focuses on mitigating the so-called "Six Big Losses" of manufacturing, which map directly onto the indicator's three pillars:
| OEE Pillar | Big Loss | Common Description on the Plant Floor |
|---|---|---|
| Availability | 1. Equipment Failures / Unplanned Stoppages | Severe breakdowns in motors, hydraulic systems, or robotics. |
| Availability | 2. Setup and Adjustments / Planned Stoppages | Lengthy model changeovers or mold adjustments. |
| Performance | 3. Micro-Stoppages and Minor Interruptions | Minor stops (under 5 minutes) that don't require technical maintenance. |
| Performance | 4. Reduced Speed | The machine runs below its optimal cycle due to wear or caution. |
| Quality | 5. Process Defects | Production of parts with burrs, out of dimensional tolerance, or with cosmetic defects. |
| Quality | 6. Reduced Start-Up Yield | Waste generated while the machine reaches the ideal temperature or pressure. |
How to Calculate OEE Step by Step (With Formulas and Examples)
To illustrate the OEE calculation in a practical, down-to-earth way, we'll use a typical case study of a manufacturing or plastic injection molding cell at a plant located in Monterrey.
Step 1: Define the Base Times
Before applying the formulas, we need to gather the time data for a standard 8-hour shift (480 minutes).
- Total Shift Time: 480 minutes.
- Planned Stoppages: 30 minutes for lunch/break + 10 minutes for the shift start-up meeting = 40 minutes.
- Planned Production Time: 480 min - 40 min = 440 minutes.
- Unplanned Stoppages (Failures and Setups): 45 minutes for a pneumatic piston failure + 15 minutes for a tooling change = 60 minutes.
- Actual Operating Time: 440 min - 60 min = 380 minutes.
Step 2: Calculate Availability
The formula is:
Applying the numbers from the example:
Step 3: Calculate Performance
For this calculation, we need to know the total production and the machine's ideal cycle time.
- Ideal Cycle Time: 30 seconds per part (0.5 minutes per part).
- Total Production During the Shift: 680 parts (includes good and bad parts).
The formula is:
Applying the numbers from the example:
(Note: This means that due to micro-stoppages or slow speed, the equivalent of 40 minutes of pure production was lost).
Step 4: Calculate Quality
We need to know how many of the total parts were rejected by the quality department.
- Defective Parts (Scrap and Rework): 34 parts.
- Good Parts Produced: 680 total - 34 defective = 646 parts.
The formula is:
Applying the numbers from the example:
Calculate the Total OEE
We multiply the three percentages obtained (in decimal form):
Interpreting the Result
This line's OEE is 73.40%. Although at first glance 95% quality or 89% performance seem like acceptable numbers on their own, the multiplicative effect shows that the plant is losing 26.6% of its real production capacity on that machine.
The Global Standard (World-Class OEE)
What does having a good OEE really mean? In the international industrial arena, certain benchmarks have been established to rate efficiency:
- OEE < 65%: Low. The plant has massive opportunities for improvement. There are severe chronic maintenance problems, excessive model changeover times, or a high waste rate.
- OEE 65% - 75%: Industry average. There is basic process control, but significant losses persist that erode the organization's competitiveness.
- OEE 75% - 85%: Good. The operation is stable, profitable, and competitive in local markets.
- OEE > 85% (World Class): World Class. This is the level achieved by high-tech automotive plants and Lean Manufacturing operations. Sustaining an OEE above 85% requires automated processes, predictive maintenance, and a deeply rooted culture of continuous improvement.
Common Mistakes When Implementing and Measuring OEE
Measuring OEE seems simple on paper, but on the production floor, bad operational habits arise that invalidate the data:
- Manipulating Ideal Cycle Times: Sometimes, to make individual reports "look better," production staff use actual or historical cycle times instead of the engineering ideal cycle time. This artificially inflates the Performance percentage.
- Using Manual Paper Logbooks: Relying on the operator to write down every stoppage with a pen introduces unavoidable human error. Operators tend to round times (for example, writing "15 minutes of downtime" when it was actually 23) or simply skip recording micro-stoppages because of the pace of the shift.
- Using OEE to Punish Instead of Improve: If OEE becomes a tool for reprimanding staff, the data on the shop floor will start to be falsified. OEE should be an objective thermometer of the state of machinery and processes.
- Averaging OEE Across the Whole Plant Indiscriminately: A corporate average OEE can hide the fact that a critical assembly line is collapsing while a secondary line runs perfectly. OEE should be analyzed by specific machine, line, or cell.
The Industry 4.0 Revolution: Real-Time OEE
The traditional OEE calculation is done at the end of the day or week using Excel spreadsheets. By the time the plant manager sees that OEE dropped to 58% last Tuesday, the problem has already happened, the money has already been lost, and the causes of the failure are hard to trace accurately.
Digital transformation eliminates this time lag. By integrating industrial sensors, programmable logic controllers (PLCs), and modern monitoring software, plants in Saltillo and Monterrey are moving to real-time OEE:
- Automatic Data Capture: The software detects the exact moment a machine stops, measuring even 5-second micro-stoppages that were previously invisible.
- Immediate Categorization: Using tablets or touchscreens at the workstation, the operator can quickly select the reason for the stoppage (e.g., "material shortage," "robot adjustment") with a single tap, populating the database cleanly.
- Dynamic Dashboards: Supervisors view andon charts and dashboards on giant screens on the production floor, and executives access corporate indicators from their mobile devices anywhere.
- Proactive Alerts: If a priority line's OEE falls below the set limit for more than 10 minutes, the system sends an automatic notification to the maintenance team to intervene before it affects the daily target.
Conclusion
Calculating and improving OEE isn't a one-time project but a continuous cycle of diagnosis and optimization. By implementing this metric strictly and transparently, organizations reduce manufacturing costs, postpone costly investments in unnecessary machinery (by freeing up the hidden capacity of current equipment), and raise the quality standards demanded by global markets.
If your plant still relies on handwritten reports or outdated Excel files to evaluate productivity, it's time to take the step toward industrial digitalization.
Does your plant measure OEE with paper and Excel? Make the leap to Industry 4.0.
Leave outdated data and invisible failures behind. At LT CODER we develop real-time OEE and KPI Dashboards and custom technology infrastructure for manufacturing and automotive plants in Saltillo and Monterrey. Unlock the hidden capacity of your machines and take full control of your production today.
Schedule a demo with our engineers