Real-Time Dashboards and Indicators
The era of running a plant based on the previous day's reports is over. In the context of Industry 4.0, real-time visibility isn't a luxury; it's the standard for staying competitive, reducing scrap, and maximizing operational efficiency.
What Is an Industrial Dashboard?
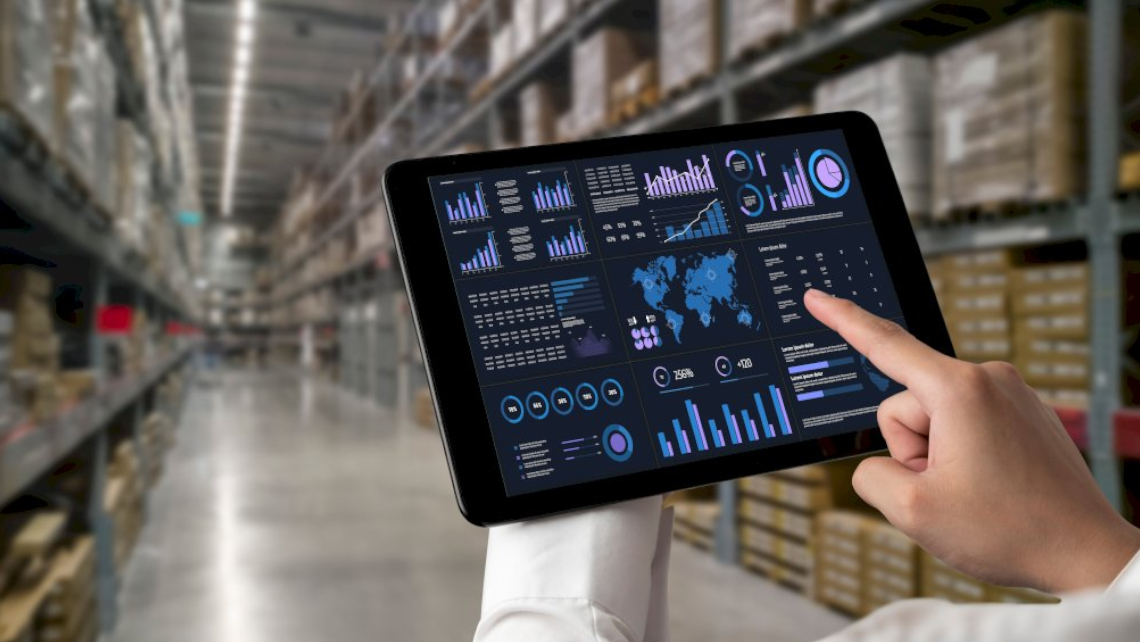
An industrial dashboard is a centralized visualization platform that turns raw data from production lines, IoT sensors, ERP systems, and MES into actionable real-time information.
Unlike traditional administrative reports, an industrial dashboard is designed for the plant environment: it is dynamic and visual, and it allows managers and operators to make critical decisions in seconds to avoid unscheduled stoppages.
Benefits of Real-Time Monitoring
Implementing dashboards in your manufacturing plant offers immediate competitive advantages:
- Proactive decision-making: Identify bottlenecks before they affect the production line.
- Reduced downtime: React instantly to machine failures or material shortages.
- Data-driven culture: Align operators, quality, and maintenance teams around the same visual metrics.
- End-to-end visibility: Monitor multiple production lines or plants from a single screen, even remotely.
Most Widely Used KPIs in Industry
A dashboard is only as good as the indicators it displays. We design screens based on the key metrics of manufacturing:
| KPI | What does it measure? | Business Impact |
|---|---|---|
| OEE (Overall Equipment Effectiveness) | Machine Availability, Performance, and Quality. | The ultimate indicator of plant productivity. |
| Cycle Time | The time it takes to produce a single unit. | Optimization of the production pace (Takt Time). |
| Rejection / Scrap Rate | Percentage of defective parts out of total production. | Reduced material costs and waste. |
| MTBF / MTTR | Mean time between failures and mean time to repair. | Direct evaluation of maintenance efficiency. |
Integrations: We Connect Your Entire Industrial Ecosystem
We don't create information silos. Our dashboards connect directly with the technologies you already use every day:
Plant Systems: PLCs, IoT Sensors, SCADA, MES Systems.
Management Systems: ERPs (SAP, Oracle, Dynamics), CRMs, and SQL / NoSQL databases.
Use Cases by Department
Our visual solutions adapt to the language and needs of each critical area of the company:
Production
Monitoring of hourly target attainment, line speed, and control of micro-stoppages. You'll know exactly whether the shift will meet its quota before the day ends.
Quality
Real-time statistical process control (SPC) charts, logging of the most common defects, and automatic alerts when tolerance limits start to drift.
Maintenance
Monitoring of machine conditions (temperature, vibration, amperage). Visualization of work order status and predictive maintenance indicators.
Logistics
Tracking of loading and unloading times, warehouse inventory turnover (WMS), and the status of material supply to production lines (Just-in-Time).
Ready to turn your plant's data into profitability?
Leave outdated spreadsheets behind and take full control of your production today.